The Only 4 LinkedIn KPIs Worth Tracking

What each one measures, where to find it, how to read it, and what to change when it stalls. Impressions are not on the list, on purpose.
ps - if you would rather we set the whole system up on your account with you live, book a setup call with the Founder of Reachium.
Don't have a Reachium account yet? Make your Reachium account here
⭐️ Trusted by 2,500+ sales teams, 1,022 meetings booked across Reachium accounts in the last 12 months ⭐️
Why impressions are a lie
LinkedIn puts impressions on the front page of your analytics because it is the number that keeps you posting. It is not the number that pays you.
What most people do: post, check impressions the next morning, feel good or bad about the day based on that one figure, and post more when it is high. Then the month ends, nobody booked, and they cannot work out what went wrong.
What impressions actually measure: how many strangers scrolled past you. That is it. Impressions can triple because a post got picked up by people who do the same job as you and will never buy anything. They can also stay flat while a smaller, more relevant audience quietly turns into pipeline.
Only four numbers on LinkedIn predict revenue, and they all move before revenue does. Track those. Ignore the one on the front page.
Steal this first
Before you read the four, do this on your last post. It takes 60 seconds.
Open the post, click View analytics, and fill this in:
(reactions ___ + comments ___) / impressions ___ x 100 = ___ percentNow do the same for the post before it. If the second number is higher than the first, the post with fewer impressions reached better people. That is the whole argument of this document in two lines of arithmetic. Everything below tells you what to do about it.
KPI 1: Profile views
What it measures. Someone read a post, or received a message, and went to check who you are. It is the first sign of genuine interest, and the first number that moves when content starts landing. Nobody views a profile by accident.
Why it moves before revenue. Every booked call starts with a profile visit. A stranger reads the headline, the about section and the featured resource before they decide whether you are worth a reply. Profile views are the top of your funnel that LinkedIn actually shows you.
Where to find it. Open LinkedIn, click your photo top left, then View profile. Scroll to the Analytics block under your headline. The first tile is profile views for the last 90 days. Click it for the trend. Direct route: linkedin.com/analytics/profile-views/ (LinkedIn moves these pages around, so if the URL changes, the Analytics block on your profile always has it).
Healthy versus stalled. Healthy is a line that climbs week over week, even slowly, and spikes the day after a post that landed. Stalled is flat for three weeks while you are posting, or a spike with no follow-through. Compare against your own last four weeks, not against anyone else's number.
What to change first when it stalls. The subject or the headline. If people are seeing posts and not clicking through, the posts are not making them curious about the author. Narrow the subject to one problem for one kind of person, and rewrite the headline so it says who you help and with what. Then post at the same cadence for two weeks before judging again.
Profile views weekly note:
Week of ___: ___ views (last week ___). Best day: ___ after the post about ___.
KPI 2: Connection requests received
What it measures. Interest strong enough to act on. A profile view is a look. A connection request is a hand raised. This is the number that tracks closest to inbound for us.
Why it moves before revenue. Inbound requests are people choosing to be in your network without being asked. Every one of them can be messaged for free, forever, and a meaningful share of them are buyers who are not ready yet. Six weeks later, they are.
Where to find it. Click My network at the top, then Manage my network, then Invitations. The Received tab shows who is waiting. Direct route: linkedin.com/mynetwork/invitation-manager/. Count the new ones each week; LinkedIn does not chart this one for you, which is exactly why nobody tracks it.
Healthy versus stalled. Healthy is requests arriving every week from people you did not message first, with titles that look like your buyer. Stalled is requests only from recruiters, students and people selling to you, or none at all for two weeks while you are posting.
What to change first when it stalls. The about section and the featured resource. People are viewing but not connecting, which means the profile is not giving them a reason. Rewrite the about section to one buyer in the second person, and put one free resource in the featured slot that only makes sense to that buyer. If the requests are coming but from the wrong people, the posts are aimed at your peers instead of your buyers: name the buyer in the post.
Weekly request note:
Received: ___ (last week ___). From buyers: ___. From peers/recruiters/sellers: ___.
KPI 3: Engagement rate, not engagement count
What it measures. Reactions plus comments, divided by impressions. Not the count. The count goes up when more strangers see the post. The rate tells you whether the people who saw it were the right people.
Why it moves before revenue. A post with 2,000 impressions and 80 reactions reached people who cared. A post with 40,000 impressions and 80 reactions reached a crowd. Only the first one fills a pipeline, and the feed rewards the first one with more of the right people next time.
Where to find it. Open any of your posts and click View analytics under it (or the small chart icon). You get impressions, reactions, comments and reposts for that post. For the whole account: click your photo, View profile, then in the Analytics block choose Post impressions, or go to linkedin.com/analytics/creator/content/. LinkedIn does not calculate the rate for you, so:
Engagement rate = (reactions + comments) / impressions x 100

Example: (64 + 19) / 3,100 x 100 = 2.7 percent
Healthy versus stalled. Healthy is a rate that holds or climbs as impressions grow, and comments making up a rising share of the engagement. Stalled is impressions climbing while the rate falls (you are reaching more of the wrong people) or a rate that only holds on posts about your peers' problems rather than your buyers'.
What to change first when it stalls. Who the post is for. Write about the buyer's problem, not the craft of writing about it. Name the buyer in the first three lines so the room filters itself. Cut daily filler, since weak posts drag the rate down and teach the feed your content does not hold attention. Stay for the first hour after posting and reply to every comment; author replies lift the rate faster than anything else.
KPI 4: Leads generated
What it measures. Anyone who asked for something. A keyword comment on a resource post, a DM asking a question, a reply to your outreach with interest, a click on your booking link. This is the number the other three exist to move.
Why it moves before revenue. A lead is a conversation you have not had yet. Booked calls lag leads by one to six weeks, so the lead count this month is next month's calendar.
Where to find it. LinkedIn does not track this for you at all. You count it. Comments for a resource: the comment count on each lead-magnet post. DMs and interested replies: your inbox, by hand, or the flagged conversations in Reachium. Booking clicks: your calendar tool's link stats. If Reachium is running the funnel, the campaign row shows captured, DMs sent, replies and bookings per post without counting anything.
Healthy versus stalled. Healthy is leads arriving weekly from at least two of the three sources (comments, DMs, outreach replies), and a rising share of them from people who match your buyer. Stalled is a resource post that gets comments from people who collect templates and nobody who buys, or an inbox where interested replies sit for days. Count customers, not hands: on our own numbers one post pulled 507 leads and made 3 customers, a smaller one pulled 207 and made 8.
What to change first when it stalls. If comments are low, you are not giving anything away, or the resource is aimed at everyone. Promise something that only makes sense to someone already doing the work. If comments are fine and calls are not, the leak is speed: half of all replies arrive within 17.7 hours of a connection, and a lead answered three days later is a stranger again. If outreach replies are low, the list is wrong before the message is.
Weekly lead note:
Comments for a resource: ___   DMs / interested replies: ___   Booking clicks: ___
Answered same day: ___ / ___   Buyers among them: ___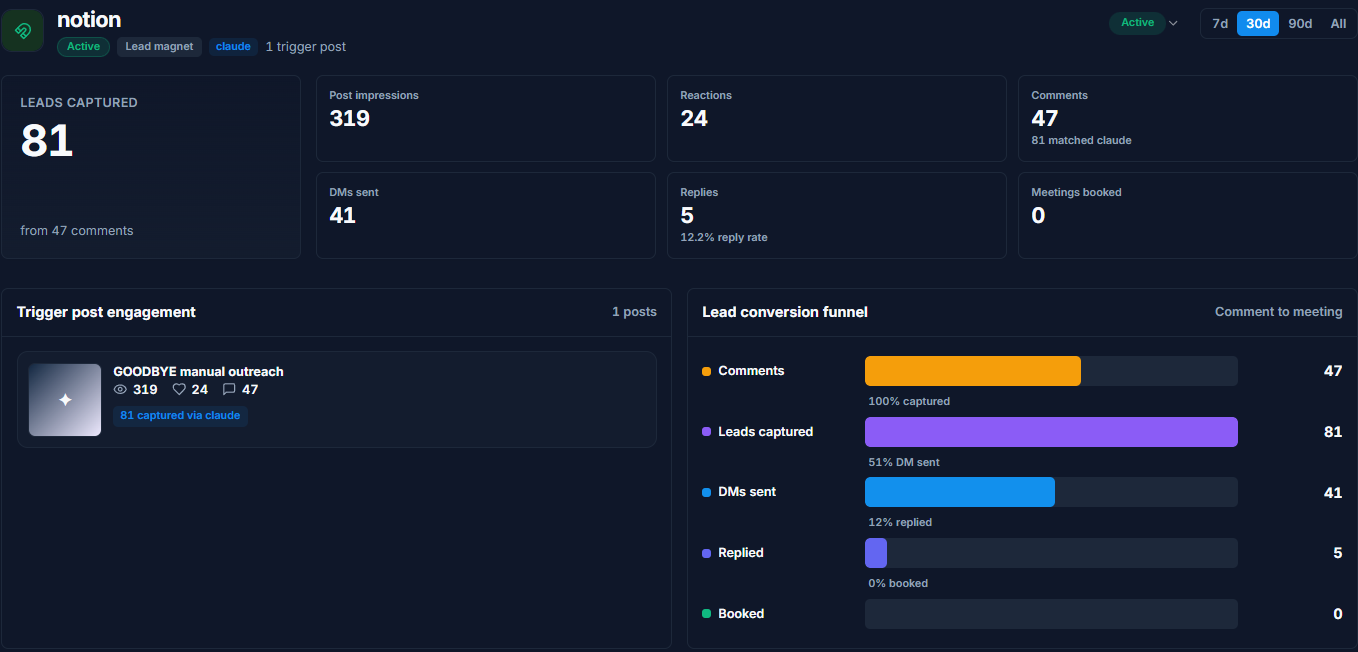
The fourth number, counted for you: comments, captured, DMs, replies, booked, on one row.
The five-minute weekly review
One line per number, every Sunday night or Monday morning. Five minutes. Copy this block into your notes app.
Week of ________

1. Profile views:            ___  (last week ___)  up / flat / down
2. Requests received:        ___  (last week ___)  from buyers: ___
3. Engagement rate:          ___% (last week ___%) comments share: ___%
4. Leads generated:          ___  (last week ___)  answered same day: ___ / ___

Impressions (for the record only, do not act on it): ___

One thing to change this week based on the above: ________________
The reading rule. All four up is a good week even if impressions fell. Impressions up while all four are flat means a post reached the wrong crowd. Change one thing per week, never four, or you will not know what worked.
The vanity metrics to stop checking
Each of these feels like progress and lies to you in its own way.
Impressions. Measures strangers scrolling past. Triples when peers share you, stays flat when buyers read you. The one number LinkedIn shows you first, and the least connected to revenue.
Follower count. The feed no longer gates reach by followers, so this measures your past, not your future. A 900-follower account writing for one buyer can out-book a 50,000-follower account writing for everyone.
Reaction count. A like is a nod, not a hand raised. Counts rise with reach, not with relevance. Divide by impressions or ignore it.
Search appearances. Worth a glance once a month as a profile health check, since it moves when your headline keywords change. Useless week to week.
Post count and streaks. Posting daily is not a metric, it is a cost. Three posts that get saved beat six that get skimmed, and the six teach the feed the wrong lesson.
Profile completeness and Social Selling Index. LinkedIn's own scores for how much LinkedIn you use. They correlate with time spent on the platform, not with meetings.
Bad week: 41,000 impressions, 12 new followers, no requests received, two comments, nobody booked.
Good week: 3,800 impressions, profile views up 40 percent, 6 requests from VPs of Sales, 4 keyword comments, 1 call booked.

Workspace totals across all accounts. Impressions are the biggest number and the least useful one.
Your first 48 hours
Find all four numbers today and write them down as your baseline
Put the five-minute review block in your notes app with a Sunday reminder
Remove the impressions tab from your morning routine
Rewrite the headline if profile views are flat: who you help and with what
Put one free resource in the featured slot if requests are not arriving
Answer every open conversation in your inbox today, then keep it at same-day
What we will not promise
We will not give you a benchmark number for any of the four. Your market, your buyer and your list decide what good looks like, so compare against your own last four weeks and act on direction.
We will not tell you impressions do not matter at all. They are the top of the funnel. They are just the one number that cannot tell you whether the funnel works.
Two things we will promise. Nothing leaves your account that you have not approved. And the 25 a day outreach cap does not move, on any plan, for any price.
If you would rather not count by hand
Everything in this document works with LinkedIn's own analytics pages and a notes app. Plenty of people run it that way.
What Reachium does is count the fourth number for you and move the other three: every keyword comment, DM and interested reply lands in one inbox with the ones that matter flagged, every lead-magnet post shows captured, delivered, replied and booked on one row, and the outreach that drives profile views and requests runs inside the limits while you sleep. Claude reads the numbers back to you in one sentence on Monday morning.
Either way, write the four baseline numbers down today. You cannot see a trend you never started measuring.
- Jordan Kwan, founder of Reachium